
YouTube Views with XGBoost

I wanted to find the features that help me get more views on YouTube. Identified which YouTube videos are successful with 86% accuracy. I used the YouTube API to gather data from my competitors on YouTube. I also used Google Vision’s deep learning models to analyze thumbnail images, and add that data to the YouTube API data. Data from nearly 2,000 videos was used to train and test an XGBoost model.
1. Objective
We want to classify videos as successful (high views per subscriber) or unsuccessful by scraping data from YouTube and using the data to train an XGBoost model. The main sources of data for this project are the APIs for YouTube and GoogleVision. From these two sources we gather information about each of my competitor’s YouTube channels: views, subscribers, number of videos, titles of the videos, duration of each video, etc. From the YouTube API I also extract the thumbnail URL for each video. Later I explain how the Google Vision API analyzes the image of the thumbnail for facial and text recognition. I combine the YouTube data and the thumbnail data together for the analysis.
2. Import the necessary libraries and data set
2.1. Libraries
The libraries used in this project are the following.
import os
from numpy.core.fromnumeric import shape
from numpy.lib.function_base import diff
import pandas as pd
import re
from datetime import datetime, timedelta
import numpy as np
import matplotlib.pyplot as plt
from pandas.core.indexes.base import Index
import emoji
from scipy import stats
# import fasttext
from collections import Counter
from pprint import pprint
from IPython.display import display_html
from itertools import chain,cycle
import seaborn as sns
from sklearn.model_selection import train_test_split,GridSearchCV
import shap
import xgboost as xgb
import matplotlib.pylab as pl
from sklearn.metrics import confusion_matrix, accuracy_score,roc_curve,roc_auc_score
import warnings
import altair as alt
from statsmodels.stats.outliers_influence import variance_inflation_factor
from patsy import dmatrices
warnings.filterwarnings('ignore')
warnings.simplefilter('ignore')
2.2. Data Sets
I merge together all the datasets taken from YouTube’s API with the Google Vision API thumbnail image data. You can see the full code below for retrieving this data.
Here is the YouTube API Data Pull CODE
import json import requests from numpy import random from time import sleep import os class YTstats: def __init__(self, api_key, channel_id): self.api_key = api_key self.channel_id = channel_id self.channel_statistics = None self.video_data = None def extract_all(self): self.get_channel_statistics() self.get_channel_video_data() def get_channel_statistics(self): """Extract the channel statistics""" print('get channel statistics...') url = f'https://www.googleapis.com/youtube/v3/channels?part=statistics&id={self.channel_id}&key={self.api_key}' json_url = requests.get(url) data = json.loads(json_url.text) try: data = data['items'][0]['statistics'] except KeyError: print('Could not get channel statistics') data = {} self.channel_statistics = data return data def get_channel_video_data(self): global s s = requests.Session() "Extract all video information of the channel" print('get video data...') channel_videos, channel_playlists = self._get_channel_content(limit=50) parts=["snippet", "statistics","contentDetails", "topicDetails"] print(len(channel_videos)) ii = 0 for video_id in channel_videos: ii += 1 print(ii/len(channel_videos)) for part in parts: data = self._get_single_video_data(video_id, part) channel_videos[video_id].update(data) self.video_data = channel_videos return channel_videos def _get_single_video_data(self, video_id, part): """ Extract further information for a single video parts can be: 'snippet', 'statistics', 'contentDetails', 'topicDetails' """ sleep(random.uniform(1, 3)/2) url = f"https://www.googleapis.com/youtube/v3/videos?part={part}&id={video_id}&key={self.api_key}" json_url = s.get(url) data = json.loads(json_url.text) print(url) try: data = data['items'][0][part] except KeyError as e: print(f'Error! Could not get {part} part of data: \n{data}') data = dict() return data def _get_channel_content(self, limit=None, check_all_pages=True): """ Extract all videos and playlists, can check all available search pages channel_videos = videoId: title, publishedAt channel_playlists = playlistId: title, publishedAt return channel_videos, channel_playlists """ url = f"https://www.googleapis.com/youtube/v3/search?key={self.api_key}&channelId={self.channel_id}&part=snippet,id&order=date" if limit is not None and isinstance(limit, int): url += "&maxResults=" + str(limit) vid, pl, npt = self._get_channel_content_per_page(url) idx = 0 while(check_all_pages and npt is not None and idx < 50 and num_pages < 2): nexturl = url + "&pageToken=" + npt next_vid, next_pl, npt = self._get_channel_content_per_page(nexturl) vid.update(next_vid) pl.update(next_pl) idx += 1 print(check_all_pages, idx, npt) return vid, pl def _get_channel_content_per_page(self, url): """ Extract all videos and playlists per page return channel_videos, channel_playlists, nextPageToken """ sleep(random.uniform(1, 3)) json_url = requests.get(url) data = json.loads(json_url.text) channel_videos = dict() channel_playlists = dict() if 'items' not in data: print('Error! Could not get correct channel data!\n', data) return channel_videos, channel_playlists, None global num_pages num_pages+=1 nextPageToken = data.get("nextPageToken", None) item_data = data['items'] for item in item_data: try: kind = item['id']['kind'] published_at = item['snippet']['publishedAt'] title = item['snippet']['title'] if kind == 'youtube#video': video_id = item['id']['videoId'] channel_videos[video_id] = {'publishedAt': published_at, 'title': title} elif kind == 'youtube#playlist': playlist_id = item['id']['playlistId'] channel_playlists[playlist_id] = {'publishedAt': published_at, 'title': title} except KeyError as e: print('Error! Could not extract data from item:\n', item) return channel_videos, channel_playlists, nextPageToken def dump(self): """Dumps channel statistics and video data in a single json file""" if self.channel_statistics is None or self.video_data is None: print('data is missing!\nCall get_channel_statistics() and get_channel_video_data() first!') return fused_data = {self.channel_id: {"channel_statistics": self.channel_statistics, "video_data": self.video_data}} channel_title = self.video_data.popitem()[1].get('channelTitle', self.channel_id) channel_title = channel_title.replace(" ", "_").lower() filename = channel_title + '.json' with open(filename, 'w') as f: json.dump(fused_data, f, indent=4) print('file dumped to', filename) #brian hull UCiNeUoUWfBLC8mJuMzI6hvw #Black Gryphon UCvzWGXYFDiiJ338KIJPhbhQ #Brock Baker UCLzdMXE3R2xXIklfIO9HCcQ # Ori UCra3g9Qvmgux0NyY2Pdj4Lw # Scheiffer Bates UCcBacTJIf67LSU_-yeJwDvg #Azerrz UCiwIAU4SNlrcv47504JrJeQ #Danny padilla & mason sperling UCfhK8MfxO-9RCypkLDyW1rw # Brizzy UC7lObFRyZgoZcMYHHqxi9lg # Redfireball UC88CnZTYFz5ugp-JtDEQ3-g # Sounds like pizza UCh6OfzCefcCGFfihPbe_Y4g #joshiiwuh UCxRGk49YNiW3Cq8s7MGknqw # simau UCkXvCWJjAqNcFwxF7hW_ZRQ #Knep UCy7gv-FM-dMvw6dMtj8Qfgg # charlie hopkinson UCewLMcro9tNP97XQ1rxtLXQ #Uss JA doin UCqPYUMNbVeEhyTBIZCDO_VQ # Shanieology UCR93YdwZ4UKEUwf1gA-ZusA # BigShade UC7Wt6Nukmt83Bph3us5s5Aw # Best in Class UClQhFMEVUxJAwMW-KdZ0SvQ # Daniel Ferguson UCXFzOJmXVaP1tMLiww4aQzg # Mikey Boltz UC0gXT2T6KtmV0IHNNNvruAQ # Maxamili UC-0WjH-efG2qvNlZUBlX70Q api_key= os.environ.get('YT_API') # channel_ids= ['UCiNeUoUWfBLC8mJuMzI6hvw','UCvzWGXYFDiiJ338KIJPhbhQ','UCLzdMXE3R2xXIklfIO9HCcQ','UCra3g9Qvmgux0NyY2Pdj4Lw','UCcBacTJIf67LSU_-yeJwDvg', # 'UCiwIAU4SNlrcv47504JrJeQ','UCfhK8MfxO-9RCypkLDyW1rw','UC7lObFRyZgoZcMYHHqxi9lg','UC88CnZTYFz5ugp-JtDEQ3-g','UCh6OfzCefcCGFfihPbe_Y4g', # 'UCxRGk49YNiW3Cq8s7MGknqw','UCkXvCWJjAqNcFwxF7hW_ZRQ','UCy7gv-FM-dMvw6dMtj8Qfgg','UCewLMcro9tNP97XQ1rxtLXQ','UCqPYUMNbVeEhyTBIZCDO_VQ', # 'UCR93YdwZ4UKEUwf1gA-ZusA','UC7Wt6Nukmt83Bph3us5s5Aw','UClQhFMEVUxJAwMW-KdZ0SvQ','UCXFzOJmXVaP1tMLiww4aQzg','UC0gXT2T6KtmV0IHNNNvruAQ', # 'UC-0WjH-efG2qvNlZUBlX70Q'] channel_ids= ['UC-0WjH-efG2qvNlZUBlX70Q','UClQhFMEVUxJAwMW-KdZ0SvQ'] for channel_id in channel_ids: global num_pages num_pages = 0 yt = YTstats(api_key,channel_id) yt.get_channel_statistics() yt.get_channel_video_data() yt.dump()
Here is the Convert JSON to Pandas CODE
import json from os import replace import pandas as pd import re from datetime import datetime, timedelta import cv2 import urllib import numpy as np from skimage import io import matplotlib.pyplot as plt #C:/Users/merre/Desktop/data projects/ files= ["shanieology.json","simau.json","soundslikepizza.json","azerrz.json","BigShade.json","black_gryph0n.json" ,"brian_hull.json","brizzy_voices.json","brock_baker.json","charlie_hopkinson.json","danny_padilla_&_mason_sperling.json" ,"ja_doin_stuff.json","joshiiwuh.json","knep.json","ori.json","redfireball555.json","scheiffer_bates.json","daniel_ferguson.json", "BigShade.json","best_in_class.json","maxamili.json","mikey_bolts.json"] data=None df_channel_new=None df_channel = None for file in files: with open(file,'r') as f: data = json.load(f) channel_id, stats = data.popitem() channel_stats=stats["channel_statistics"] video_stats = stats["video_data"] channel_views= channel_stats["viewCount"] channel_subs= channel_stats["subscriberCount"] channel_videos= channel_stats["videoCount"] try: sorted_vids = sorted(video_stats.items(), key=lambda item: int(item[1]["viewCount"]), reverse=True) except: sorted_vids = video_stats.items() stats = [] for vid in sorted_vids: video_id = vid[0] title = vid[1]["title"] title_len = len(title) title_words = re.findall(r'\w+',title) words=0 upper_words=0 for word in title_words: words += 1 if word.isupper(): upper_words += 1 upper_pct = upper_words/words emoji_count = len(re.findall(u'[\U0001f600-\U0001f650]', title)) #Convert time to Mexico City Time upload_date_time = datetime.strptime(vid[1]["publishedAt"],'%Y-%m-%dT%H:%M:%SZ')-timedelta(hours=5) upload_date = upload_date_time.date() upload_time = upload_date_time.time() #0 is Monday, 6 is Sunday upload_day = upload_date.weekday() if datetime.strptime('04:00:00', '%H:%M:%S').time() <= upload_time <= datetime.strptime('10:30:00', '%H:%M:%S').time(): upload_time_of_day = 'morning' elif datetime.strptime('10:30:01', '%H:%M:%S').time() <= upload_time <= datetime.strptime('18:00:00', '%H:%M:%S').time(): upload_time_of_day = 'afternoon' elif datetime.strptime('18:00:01', '%H:%M:%S').time() <= upload_time <= datetime.strptime('23:00:00', '%H:%M:%S').time(): upload_time_of_day = 'night' else: upload_time_of_day = "late_night" try: thumbnail_url = vid[1]["thumbnails"]["maxres"]["url"] thumbnail_h = vid[1]["thumbnails"]["maxres"]["height"] thumbnail_w = vid[1]["thumbnails"]["maxres"]["width"] except: try: thumbnail_url = vid[1]["thumbnails"]["high"]["url"] thumbnail_h = vid[1]["thumbnails"]["high"]["height"] thumbnail_w = vid[1]["thumbnails"]["high"]["width"] except: try: thumbnail_url = vid[1]["thumbnails"]["default"]["url"] thumbnail_h = vid[1]["thumbnails"]["default"]["height"] thumbnail_w = vid[1]["thumbnails"]["default"]["width"] except: thumbnail_url=None thumbnail_h=None thumbnail_w=None try: channel = vid[1]["channelTitle"] except: channel=None try: tags = vid[1]["tags"] except: tag = None num_tags = len(tags) try: categoryId = vid[1]["categoryId"] except: categoryId=None try: liveBroadcastContent = vid[1]["liveBroadcastContent"] except: liveBroadcastContent = None try: defaultAudioLanguage = vid[1]["defaultAudioLanguage"] except: defaultAudioLanguage = None try: viewCount = vid[1]["viewCount"] except: viewCount = None try: likeCount = vid[1]["likeCount"] except: likeCount =None try: dislikeCount = vid[1]["dislikeCount"] except: dislikeCount=None try: favoriteCount = vid[1]["favoriteCount"] except: favoriteCount = None try: commentCount = vid[1]["commentCount"] except: commentCount=None try: duration0 = vid[1]["duration"] except: duration0=None try: hours = int(re.findall(r'\d+H',duration0)[0].replace('H','')) except: hours = None try: mins = int(re.findall(r'\d+M',duration0)[0].replace('M','')) except: mins=None try: secs = int(re.findall(r'\d+S',duration0)[0].replace('S','')) except: secs=0 if hours is not None and mins is not None and secs is not None: duration = hours*60 + mins + secs/60 elif mins is not None and secs is not None: duration = mins + secs/60 elif secs is not None: duration = secs/60 try: definition = vid[1]["definition"] except: definition =None try: captions = vid[1]["caption"] except: captions = None try: licensedContent = vid[1]["licensedContent"] except: licensedContent=None try: projection = vid[1]["projection"] except: projection = None try: topicCategories = vid[1]["topicCategories"] except: topicCategories = None try: desc = vid[1]["description"] except: desc = None video_id = vid[0] stats.append([video_id,title,title_len,words,upper_pct,emoji_count,upload_date,upload_time,upload_day,upload_time_of_day,viewCount,likeCount,dislikeCount,favoriteCount, commentCount,duration,definition,captions,licensedContent,thumbnail_url, thumbnail_w, thumbnail_h, tags,num_tags,categoryId,liveBroadcastContent, defaultAudioLanguage,topicCategories, channel, channel_subs, channel_views, channel_videos,desc]) df = pd.DataFrame(stats) df.columns = ['video_id','title','title_len','words','upper_pct','emoji_count','upload_date','upload_time','upload_day','upload_time_of_day','viewCount','likeCount','dislikeCount', 'favoriteCount','commentCount','duration','definition','caption','licensedContent','thumbnail_url', 'thumbnail_w', 'thumbnail_h', 'tags','num_tags', 'categoryId','liveBroadcastContent','defaultAudioLanguage','topicCategories', 'channel', 'channel_subs', 'channel_views', 'channel_videos','desc'] df.to_csv(file.replace('json','txt'))
Here is the Functions to Query Google Vision API CODE
import httplib2 import sys from googleapiclient import discovery from oauth2client import tools, file, client import json import os import cv2 from base64 import b64encode import numpy as np # limited preview only (sorry!) API_DISCOVERY_FILE = os.environ.get('GOOGLE_VISION_API') """ Google Authentication Utilities """ def get_vision_api(): credentials = get_api_credentials('https://www.googleapis.com/auth/cloud-platform') with open(API_DISCOVERY_FILE, 'r') as f: doc = f.read() return discovery.build_from_document(doc, credentials=credentials, http=httplib2.Http()) def get_api_credentials(scope, service_account=True): """ Build API client based on oAuth2 authentication """ # STORAGE = file.Storage(os.environ.get('GOOGLE_VISION_API')) #local storage of oAuth tokens STORAGE = file.Storage(API_DISCOVERY_FILE) #local storage of oAuth tokens credentials = STORAGE.get() if credentials is None or credentials.invalid: #check if new oAuth flow is needed if service_account: #server 2 server flow # with open(os.environ.get('GOOGLE_VISION_API')) as f: with open(API_DISCOVERY_FILE) as f: account = json.loads(f.read()) email = account['client_email'] key = account['private_key'] credentials = client.SignedJwtAssertionCredentials(email, key, scope=scope) STORAGE.put(credentials) else: #normal oAuth2 flow CLIENT_SECRETS = os.path.join(os.path.dirname(__file__), 'client_secrets.json') FLOW = client.flow_from_clientsecrets(CLIENT_SECRETS, scope=scope) PARSER = argparse.ArgumentParser(description=__doc__, formatter_class=argparse.RawDescriptionHelpFormatter, parents=[tools.argparser]) FLAGS = PARSER.parse_args(sys.argv[1:]) credentials = tools.run_flow(FLOW, STORAGE, FLAGS) return credentials """ read/write utilities """ def read_image(filename): return cv2.imread(filename) def save_image(filename, im): cv2.imwrite(filename, cv2.cvtColor(im, cv2.COLOR_RGB2BGR)) def read_image_base64(filename): with open(filename, 'rb') as f: return b64encode(f.read()) """ OpenCV drawing utilities """ def draw_face(im, annotations): faces = [] for a in annotations: if a['detectionConfidence'] > .4: try: tl_,br_ = draw_box(im, a['fdBoundingPoly']['vertices']) except: tl_,br_=None try: joy = a['joyLikelihood'] except: joy='' try: sad = a['sorrowLikelihood'] except: sad='' try: angry = a['angerLikelihood'] except: angry = '' try: suprise=a['surpriseLikelihood'] except: suprise='' emotions=[joy,sad,angry,suprise] if 'VERY_LIKELY' in emotions: emotion = emotions.index('VERY_LIKELY') elif 'LIKELY' in emotions: emotion = emotions.index('LIKELY') elif 'POSSIBLE' in emotions: emotion = emotions.index('POSSIBLE') else: emotion=None if emotion==0: text= "happy" elif emotion==1: text="sad" elif emotion==2: text="angry" elif emotion==3: text="suprised" else: text="other" faces.append(text) if im is not None and tl_ is not None: draw_text(im, text ,tl_) try: for landmark in a['landmarks']: if im is not None: try: draw_point(im, landmark['position']) except: pass except: pass return faces def extract_vertices(vertices): """ Extract two opposite vertices from a list of 4 (assumption: rectangle) """ min_x,max_x,min_y,max_y = float("inf"),float("-inf"),float("inf"),float("-inf") for v in vertices: if v.get('x',min_y) < min_x: min_x = v.get('x') if v.get('x',max_y) > max_x: max_x = v.get('x') if v.get('y',min_y) < min_y: min_y = v.get('y') if v.get('y',max_y) > max_y: max_y = v.get('y') try: v1 = next(v for v in vertices if v.get('x') == min_x and v.get('y') == min_y) v2 = next(v for v in vertices if v.get('x') == max_x and v.get('y') == max_y) except: v1=None v2=None return v1,v2 def draw_box(im, vertices): v1,v2 = extract_vertices(vertices) try: pt1 = (v1.get('x',0), v1.get('y',0)) pt2 = (v2.get('x',0), v2.get('y',0)) cv2.rectangle(im, pt1, pt2, (0,0,255),thickness=4) except: pt1=None pt2=None return pt1, pt2 def draw_point(im, position): pt = (int(position.get('x',0)), int(position.get('y',0))) cv2.circle(im, pt, 3, (0,0,255)) return pt def draw_text(im, text,loc): font_face = cv2.FONT_HERSHEY_SIMPLEX #thickness = 1 thickness=round(0.002 * (im.shape[0] + im.shape[1]) / 2) + 10 # for scale in np.arange(20,0,-0.2): # (w,h),baseline = cv2.getTextSize(text, font_face, scale, thickness) # if w <= im.shape[1]: # new_img = cv2.copyMakeBorder(im, 0, baseline*4, 0, 0, cv2.BORDER_CONSTANT, value=0) # cv2.putText(new_img, text, (baseline*2 +20 ,new_img.shape[0]-baseline +20 ), font_face, 2, (255,255,255), thickness) # return new_img new_img = im cv2.putText(new_img, text, loc, font_face, 2.5, (102,255,0), thickness) return new_img
Here is the Google Vision API Data Pull CODE
from datetime import date import datetime import json from webbrowser import get from google.cloud.vision_v1.types.image_annotator import AnnotateImageRequest, AnnotateImageResponse from numpy.core.fromnumeric import shape from numpy.core.numeric import NaN from numpy.lib.arraysetops import unique from skimage.util import dtype from functions_for_google_vision_api import (get_vision_api, read_image, read_image_base64, save_image, draw_face, draw_box, draw_text) from skimage import io import os from google.cloud import vision_v1 from google.cloud import vision from google.cloud.vision_v1 import types import cv2 import pandas as pd import numpy as np import itertools import time import random ##################################################################### import httplib2 from googleapiclient import discovery from oauth2client.client import GoogleCredentials os.environ['GOOGLE_APPLICATION_CREDENTIALS'] = os.environ.get('GOOGLE_VISION_API') DISCOVERY_URL='https://{api}.googleapis.com/$discovery/rest?version={apiVersion}' def get_vision_service(): credentials = GoogleCredentials.get_application_default() return discovery.build('vision', 'v1', credentials=credentials, discoveryServiceUrl = DISCOVERY_URL) def main(video_id, inputfile): service = get_vision_service() outputfile= "C:/Users/merre/Desktop/ws/data/youtube_jadoinstuff/output_images/thumbnail_" +inputfile[inputfile.rfind('/', 0, inputfile.rfind('/'))+1:inputfile.rfind('/')] + ".jpg" batch_request=[ { "features": [ { "maxResults": 50, "type": "FACE_DETECTION" }, { "maxResults": 50, "type": "LABEL_DETECTION" }, { "maxResults": 20, "type": "SAFE_SEARCH_DETECTION" }, { "maxResults": 50, "type": "TEXT_DETECTION" } ], "image": { "source": { "imageUri": inputfile } } } ] request = service.images().annotate(body={ 'requests': batch_request, }) time.sleep(random.random()*4) response = request.execute() inputfile,labels,faces,texts,adult,medical,racy,spoof,violence = show_results(inputfile, response, outputfile) vars_list = [video_id,inputfile,labels,faces,texts,adult,medical,racy,spoof,violence] i=0 for v in vars_list: if type(v) == np.ndarray: v = v.tolist() vars_list[i]=v i += 1 return vars_list def show_results(inputfile, data, outputfile): #read original file im = io.imread(inputfile) #draw face, boxes and text for each response faces=[] labels=[] texts=[] #dict_keys = data.keys() for r in data['responses']: if 'faceAnnotations' in r: faces = draw_face(im, r['faceAnnotations']) if 'labelAnnotations' in r: for label in r['labelAnnotations']: if label['score'] > .6: try: labels.append(label['description']) except: labels=labels if 'textAnnotations' in r: for a in r['textAnnotations']: if a['description'] != '': try: texts.append(a['description']) except: texts=texts if 'safeSearchAnnotation' in r: try: adult = r['safeSearchAnnotation']["adult"] except: adult='' try: medical = r['safeSearchAnnotation']["medical"] except: medical='' try: racy = r['safeSearchAnnotation']["racy"] except: racy='' try: spoof = r['safeSearchAnnotation']["spoof"] except: spoof='' try: violence = r['safeSearchAnnotation']["violence"] except: violence='' labels=unique(labels) texts=unique(texts) #save to output file save_image(outputfile, im) return inputfile,labels,faces,texts,adult,medical,racy,spoof,violence # files= ["shanieology.txt","simau.txt","soundslikepizza.txt","azerrz.txt","BigShade.txt","black_gryph0n.txt" # ,"brian_hull.txt","brizzy_voices.txt","brock_baker.txt","charlie_hopkinson.txt","danny_padilla_&_mason_sperling.txt" # ,"ja_doin_stuff.txt","joshiiwuh.txt","knep.txt","ori.txt","redfireball555.txt","scheiffer_bates.txt","daniel_ferguson.txt", # "BigShade.txt","best_in_class.txt","maxamili.txt","mikey_bolts.txt"] files= ["daniel_ferguson.txt","BigShade.txt","best_in_class.txt","maxamili.txt","mikey_bolts.txt"] vid_ids=[] vid_thumb_urls=[] for file in files: videos_loop= pd.read_csv(file) vid_ids.append(list(videos_loop[pd.to_datetime(videos_loop["upload_date"])>datetime.datetime(2012,7,1,0,0,0,0)]["video_id"])) vid_thumb_urls.append(list(videos_loop[pd.to_datetime(videos_loop["upload_date"])>datetime.datetime(2012,7,1,0,0,0,0)]["thumbnail_url"])) vid_ids=list(itertools.chain(*vid_ids)) vid_thumb_urls=list(itertools.chain(*vid_thumb_urls)) df = pd.DataFrame(columns=['video_id','thumbnail_url', 'labels','faces','texts','adult','medical','racy','spoof','violence']) ii = 0 for i in range(len(vid_ids)): if vid_thumb_urls[i] is not NaN: time.sleep(5) try: df.loc[len(df)] = main(video_id=vid_ids[i],inputfile=vid_thumb_urls[i]) ii += 1 except: pass if ii % 30 == 0 or i==len(vid_ids)-1 or i==len(vid_ids): df.to_csv('thumbnail_data_'+str(datetime.datetime.now()).replace('-','').replace(' ','_').replace(':','-')+'.txt', header=True, index=None, mode='w') print("Num videos",i,"---- Percent complete:",(round(i/len(vid_ids),3))*100)
The Google API uses deep learning to identify number of faces, facial expressions and the text contained in the thumbnail image of each YouTube video. An example is shown below of the facial recognition. The google vision also accurately identifies any text inside the thumbnail image. The thumbnail below shows that the deep learning algorithm correctly identified two surprised faces and two happy faces.

I combined the YouTube data with the thumbnail image data for each channel, including nearly 100 videos for each channel.
os.chdir("C:\\Users\\merre\\Desktop\\ws\\data\\youtube_jadoinstuff")

files= ["shanieology.txt","simau.txt","soundslikepizza.txt","azerrz.txt","BigShade.txt","black_gryph0n.txt"
,"brian_hull.txt","brizzy_voices.txt","brock_baker.txt","charlie_hopkinson.txt","danny_padilla_&_mason_sperling.txt"
,"ja_doin_stuff.txt","joshiiwuh.txt","knep.txt","ori.txt","redfireball555.txt","scheiffer_bates.txt","daniel_ferguson.txt",
"BigShade.txt","best_in_class.txt","maxamili.txt","mikey_bolts.txt"]

df = pd.DataFrame(columns=['video_id','title','title_len','words','upper_pct','emoji_count','upload_date','upload_time',
                           'upload_day','upload_time_of_day','viewCount','likeCount','dislikeCount','favoriteCount',
                           'commentCount','duration','definition','caption','licensedContent','thumbnail_url', 'thumbnail_w',
                           'thumbnail_h', 'tags','num_tags','categoryId','liveBroadcastContent',
                           'topicCategories', 'channel', 'channel_subs', 'channel_views', 'channel_videos','desc'])

#Loop through all the youtuber's data files and combine into on data frame
for file in files:
	df_add= pd.read_csv(file)
	df = df.append(df_add.drop(['Unnamed: 0'],axis=1))

#Read in the files that have the thumbnail data, and combine with the youtuber data
df_thumb = pd.read_csv("thumbnail_data_20210801_23-03-21.638854.txt").append(pd.read_csv("thumbnail_data_20210802_21-39-16.451172.txt"))
df_all = pd.merge(df.drop('defaultAudioLanguage',axis=1),df_thumb.drop(['thumbnail_url'],axis=1),on="video_id",how="inner").drop(['emoji_count'],axis=1)
df_all['all_text'] = df_all['title'].astype(str) + df_all['tags'].astype(str) + df_all['desc'].astype(str)
To get an overview of the data, let’s check the first rows and the size of the data set. We can see the data has 1,940 rows and 40 columns.
df_all
| video_id | title | title_len | words | upper_pct | upload_date | upload_time | upload_day | upload_time_of_day | viewCount | ... | desc | labels | faces | texts | adult | medical | racy | spoof | violence | all_text | |
|---|---|---|---|---|---|---|---|---|---|---|---|---|---|---|---|---|---|---|---|---|---|
| 0 | eyyTBJUKI3c | Skeletor reacts to Episode 1 of Teela and the ... | 80 | 14 | 0.000000 | 2021-07-25 | 11:22:54 | 6 | afternoon | 15005 | ... | In this video Skeletor will react and give his... | ['Action figure', 'Animated cartoon', 'Animati... | [] | ['A', 'AND', 'BAIT', 'R.I.P.', 'SWITCH!', 'THI... | UNLIKELY | UNLIKELY | UNLIKELY | LIKELY | UNLIKELY | Skeletor reacts to Episode 1 of Teela and the ... |
| 1 | S1Bmx8Dti6Y | Top 5 Worst Reboot Offences Part 2 || Skeletor... | 53 | 9 | 0.000000 | 2021-07-27 | 18:40:21 | 1 | night | 9497 | ... | In this video Skeletor finishes his top 5 wors... | ['Animated cartoon', 'Animation', 'Art', 'Ente... | ['other', 'other', 'other', 'other', 'other'] | ['Stop', 'Stop exploiting\nour nostalgia!\n', ... | VERY_UNLIKELY | UNLIKELY | VERY_UNLIKELY | LIKELY | UNLIKELY | Top 5 Worst Reboot Offences Part 2 || Skeletor... |
| 2 | DStvv0peyYQ | Top 5 Worst Reboot Offences Part 1 :Skeletor R... | 51 | 9 | 0.000000 | 2021-07-21 | 11:03:11 | 2 | afternoon | 5312 | ... | In this video Skeletor does a top 5 list of re... | ['Advertising', 'Animated cartoon', 'Animation... | ['other', 'other', 'other', 'other'] | ['1', '5', 'Hollywood', 'I', "I wonder why we ... | UNLIKELY | UNLIKELY | VERY_UNLIKELY | LIKELY | UNLIKELY | Top 5 Worst Reboot Offences Part 1 :Skeletor R... |
| 3 | PCwtNUQ3t30 | Skeletor Reacts to the new MOTU toy line Pt2 W... | 71 | 15 | 0.066667 | 2021-07-17 | 13:34:25 | 5 | afternoon | 5079 | ... | This video is part 2 of Skeletor's reaction to... | ['Animated cartoon', 'Animation', 'Art', 'Cart... | [] | ['ETERNIA', 'No', 'SHORE', 'So...', "So...\nWh... | VERY_UNLIKELY | VERY_UNLIKELY | VERY_UNLIKELY | LIKELY | UNLIKELY | Skeletor Reacts to the new MOTU toy line Pt2 W... |
| 4 | yiQto5PfuII | Skeletor Reacts to Episode 2 of Teela and the ... | 87 | 16 | 0.000000 | 2021-07-31 | 12:13:54 | 5 | afternoon | 4891 | ... | This video is part one of Skeletor watches and... | ['Animated cartoon', 'Animation', 'Art', 'Elec... | ['other'] | ['SOMETHING', 'SOMETHING\nSTINKS!\n', 'STINKS!'] | VERY_UNLIKELY | VERY_UNLIKELY | VERY_UNLIKELY | POSSIBLE | UNLIKELY | Skeletor Reacts to Episode 2 of Teela and the ... |
| ... | ... | ... | ... | ... | ... | ... | ... | ... | ... | ... | ... | ... | ... | ... | ... | ... | ... | ... | ... | ... | ... |
| 1935 | mCjhGzx3FOA | Impressions of Famous Authors | 29 | 4 | 0.000000 | 2019-07-22 | 13:53:24 | 0 | afternoon | 51825 | ... | Go to http://www.audible.com/MIKEYBOLTS or tex... | ['Audio equipment', 'Baseball cap', 'Beard', '... | ['other'] | ['AUTHORS', 'FAMOUS', 'FAMOUS\nAUTHORS\n'] | VERY_UNLIKELY | VERY_UNLIKELY | VERY_UNLIKELY | POSSIBLE | VERY_UNLIKELY | Impressions of Famous Authors['Impressions', '... |
| 1936 | aTm4yI1hbrU | 14 Things That Drive Me Nuts In 2020 | 36 | 8 | 0.000000 | 2020-08-25 | 15:02:31 | 1 | afternoon | 41215 | ... | MAN ITS GOOD TO BE BACK! :) \r\nThanks for wat... | ['Audio equipment', 'Azure', 'Baseball cap', '... | ['happy'] | ['2020', '2020\n'] | VERY_UNLIKELY | VERY_UNLIKELY | VERY_UNLIKELY | VERY_UNLIKELY | VERY_UNLIKELY | 14 Things That Drive Me Nuts In 2020['Impressi... |
| 1937 | W8cR5YsSo-I | THE QUARANTINE ANTHEM | 21 | 3 | 1.000000 | 2020-03-27 | 18:52:07 | 4 | night | 40042 | ... | A song I made about quarantine.\r\nPls Subscri... | ['Advertising', 'Brand', 'Cameras & optics', '... | ['other'] | ['MUSIC', 'MUSIC VIDEO\n', 'VIDEO'] | UNLIKELY | UNLIKELY | UNLIKELY | VERY_LIKELY | UNLIKELY | THE QUARANTINE ANTHEM['corona virus', 'corona ... |
| 1938 | DmBZ1vjOibM | IMPRESSIONS CHALLENGE 16 | Mikey Bolts | 38 | 5 | 0.400000 | 2021-04-14 | 15:06:16 | 2 | afternoon | 33362 | ... | - Hello Fellas & Stella's, Friends, and Marshe... | ['Animated cartoon', 'Audio equipment', 'Baseb... | ['happy', 'happy'] | ['00', '00\nIMPRESSIONS\nCHALLENGE\n16\n', '16... | UNLIKELY | VERY_UNLIKELY | VERY_UNLIKELY | VERY_UNLIKELY | VERY_UNLIKELY | IMPRESSIONS CHALLENGE 16 | Mikey Bolts['corona... |
| 1939 | Tyz2Pcp1p5A | HOTDOG IN A RAINCOAT - Original Animation | 41 | 6 | 0.666667 | 2021-02-22 | 14:54:14 | 0 | afternoon | 16722 | ... | hello friends. here's something i made. hope y... | ['Animated cartoon', 'Art', 'Brand', 'Cartoon'... | [] | ['@mikeybolts', 'A', 'A\nDOG\n@mikeybolts\n', ... | UNLIKELY | VERY_UNLIKELY | VERY_UNLIKELY | POSSIBLE | UNLIKELY | HOTDOG IN A RAINCOAT - Original Animation['cor... |
1940 rows × 40 columns
There are 1940 YouTube videos for the analysis and 40 features.
3. Analyze and prepare the data
In the next steps we will create new fields that could potentially be valuable, handle missing values, and determine if any columns should be left out of the study.
3.1. Missing Values and Imputation
##See if any columns have a lot of missing data
print(df_all.isna().mean().round(4))
video_id                0.0000
title                   0.0000
title_len               0.0000
words                   0.0000
upper_pct               0.0000
upload_date             0.0000
upload_time             0.0000
upload_day              0.0000
upload_time_of_day      0.0000
viewCount               0.0000
likeCount               0.0000
dislikeCount            0.0000
favoriteCount           0.0000
commentCount            0.0057
duration                0.0000
definition              0.0000
caption                 0.0000
licensedContent         0.0000
thumbnail_url           0.0000
thumbnail_w             0.0000
thumbnail_h             0.0000
tags                    0.0000
num_tags                0.0000
categoryId              0.0000
liveBroadcastContent    0.0000
topicCategories         0.0598
channel                 0.0000
channel_subs            0.0000
channel_views           0.0000
channel_videos          0.0000
desc                    0.0041
labels                  0.0000
faces                   0.0000
texts                   0.0000
adult                   0.0000
medical                 0.0000
racy                    0.0000
spoof                   0.0000
violence                0.0000
all_text                0.0000
dtype: float64
The variable topicCategories is missing almost 6% of its values. Imputation may be difficult for these categories, but I will combine similar categories and create new fields. Below are all the different topics.
unique, counts = np.unique(np.array([y for x in df['topicCategories'] for y in re.findall(r'/[\w_-]+\'',str(x).upper()) ]), return_counts=True)
dic= dict(zip(unique, counts))
dic2=dict(sorted(dic.items(),key= lambda x:x[1],reverse=True))
print(dic2)
{"/ENTERTAINMENT'": 970, "/VIDEO_GAME_CULTURE'": 545, "/ACTION-ADVENTURE_GAME'": 497, "/ACTION_GAME'": 442, "/FILM'": 265, "/ROLE-PLAYING_VIDEO_GAME'": 234, "/MUSIC'": 124, "/SPORTS_GAME'": 111, "/STRATEGY_VIDEO_GAME'": 60, "/HIP_HOP_MUSIC'": 57, "/POP_MUSIC'": 44, "/TELEVISION_PROGRAM'": 43, "/SIMULATION_VIDEO_GAME'": 14, "/HOBBY'": 13, "/FOOD'": 11, "/HUMOUR'": 8, "/TECHNOLOGY'": 7, "/CHRISTIAN_MUSIC'": 6, "/ELECTRONIC_MUSIC'": 6, "/SOUL_MUSIC'": 6, "/PET'": 4, "/RHYTHM_AND_BLUES'": 4, "/ROCK_MUSIC'": 4, "/TOURISM'": 4, "/BASKETBALL'": 3, "/PUZZLE_VIDEO_GAME'": 3, "/REGGAE'": 3, "/CASUAL_GAME'": 2, "/INDEPENDENT_MUSIC'": 2, "/PHYSICAL_FITNESS'": 2, "/SOCIETY'": 2, "/ASSOCIATION_FOOTBALL'": 1, "/HEALTH'": 1, "/PERFORMING_ARTS'": 1, "/SPORT'": 1, "/VEHICLE'": 1}
We will combine all of the topics above and create new columns called topic_entertain,topic_video_game,topic_music, and topic_film_tv. After that we will drop topicCategories as we now have new fields and imputing the missing values does not work. We will print off the new shape of the dataset to see how many rows we lost.
df_all["topic_entertain"] = [1 if any([str(x).upper().find(y) >-1 for y in ['ENTERTAINMENT']]) else 0 for x in df_all['topicCategories']]
df_all["topic_video_game"] = [1 if any([str(x).upper().find(y) >-1 for y in ['_GAME']]) else 0 for x in df_all['topicCategories']]
df_all["topic_music"] = [1 if any([str(x).upper().find(y) >-1 for y in ['MUSIC']]) else 0 for x in df_all['topicCategories']]
df_all["topic_film_tv"] = [1 if any([str(x).upper().find(y) >-1 for y in ['FILM','TELEVISION']]) else 0 for x in df_all['topicCategories']]


#Now we can drop defaultAudioLanguage since we have a replacement field for that
df_all = df_all.drop('topicCategories',axis=1)

#We can now remove all rows that have missiong values since the rows with the most missing values are gone
df_all = df_all.dropna()
df_all = df_all.reset_index()

print(shape(df_all))
(1921, 44)
3.2. Creating Additional Variables
Now we will create additional variables that may be useful to predicting the success of the YouTube video. The following uses each videos title, description, and tags to create new fields to analyze each video’s text. Regular expressions are used several times to parse out words and other special character such as emoji’s from the text.
all_labels = list(df_all["labels"])
all_labels = [ x.split(',') for x in df_all["labels"]]
all_labels = [[re.sub(r'[^a-zA-Z\u00C0-\u00FF\s]', " ",i).strip(' \t\n\r').upper() for i in ii]  for ii in all_labels]
all_labels_flat = list(set([item for elem in all_labels for item in elem]))
df_all['labels_words'] = all_labels

#Scans the title for any emojis in general

df_all["emoji_count"]= [(emoji.emoji_count(x)>0)*1 for x in df_all["title"]]

###Create variables to see how well title reflects the description, thumbnail and tags of the video

#The text read in by the ggogle vision text detection is messy.
#Need to clean up and create new variable "thumb_words", thumb_word_count"

df_all['labels_word_count']=[len(df_all['labels_words'][i]) for i in range(len(df_all))]

discard_list = ["","B",'C','D','','F','G','H','','J','K','L','M','N','','P','Q','R','S','T','V','W','X','Z']
df_all['thumb_words']=[list(set(re.sub(r'[^a-zA-Z\u00C0-\u00FF]', " ",str(re.findall(r'[^\\n][\s\?\!\"\']+[a-zA-Z\u00C0-\u00FF]+[\s\.\?\!\"\']?',str(df_all['texts'][i])))).upper().split(" "))) for i in range(len(df_all))]
for i in range(len(df_all)):
    test_list = df_all['thumb_words'][i]
    remove_list = discard_list
    df_all['thumb_words'][i] = [i for i in test_list if i not in remove_list]
df_all['thumb_word_count']=[len(df_all['thumb_words'][i]) for i in range(len(df_all))]

df_all['title_in_desc']=[((df_all['desc'][i].upper().find(df_all['title'][i].upper()))>-1)*1 for i in range(len(df_all))]
df_all['thumb_words_in_title']=[ sum([(str(df_all['title'][z]).upper().find(y)>-1)*1 for y in df_all['thumb_words'][z]]) for z in range(len(df_all['title']))]
df_all['thumb_words_in_tags']=[ sum([(str(df_all['tags'][z]).upper().find(y)>-1)*1 for y in df_all['thumb_words'][z]]) for z in range(len(df_all['tags']))]

df_all['label_words_in_title']=''
df_all['label_words_in_tags']=''

for z in range(len(df_all['title'])):
    df_all['label_words_in_title'][z]=sum([(str(df_all['title'][z]).upper().find(y)>-1)*1 for y in df_all['labels_words'][z]])
    df_all['label_words_in_tags'][z]=sum([(str(df_all['tags'][z]).upper().find(y)>-1)*1 for y in df_all['labels_words'][z]])

##See how many faces are in the thumbnails
df_all['faces_surprised']=[sum([(str(y)=='suprised')*1 for y in re.findall(r'[a-zA-Z\u00C0-\u00FF]+',df_all['faces'][z])]) for z in range(len(df_all['faces']))]
df_all['faces_angry']=[sum([(str(y)=='angry')*1 for y in re.findall(r'[a-zA-Z\u00C0-\u00FF]+',df_all['faces'][z])]) for z in range(len(df_all['faces']))]
df_all['faces_happy']=[sum([(str(y)=='happy')*1 for y in re.findall(r'[a-zA-Z\u00C0-\u00FF]+',df_all['faces'][z])]) for z in range(len(df_all['faces']))]
df_all['faces_other']=[sum([(str(y)=='other')*1 for y in re.findall(r'[a-zA-Z\u00C0-\u00FF]+',df_all['faces'][z])]) for z in range(len(df_all['faces']))]

#Combine level of some categorical fields
for i in range(len(df_all)):
    if df_all["adult"][i] in ['VERY_UNLIKELY','UNLIKELY']:
        df_all["adult"][i] = 'UNLIKELY'
    else:
        df_all["adult"][i] = 'LIKLEY'

    if df_all["medical"][i] in ['VERY_UNLIKELY','UNLIKELY']:
        df_all["medical"][i] = 'UNLIKELY'
    else:
        df_all["medical"][i] = 'LIKLEY'

    if df_all["racy"][i] in ['VERY_UNLIKELY','UNLIKELY']:
        df_all["racy"][i] = 'UNLIKELY'
    else:
        df_all["racy"][i] = 'LIKLEY'

    if df_all["spoof"][i] in ['VERY_UNLIKELY','UNLIKELY']:
        df_all["spoof"][i] = 'UNLIKELY'
    else:
        df_all["spoof"][i] = 'LIKLEY'

    if df_all["violence"][i] in ['VERY_UNLIKELY','UNLIKELY']:
        df_all["violence"][i] = 'UNLIKELY'
    else:
        df_all["violence"][i] = 'LIKLEY'

    if df_all["categoryId"][i] in [1,26,28]:
        df_all["categoryId"][i] = 99
Now we will create variables that measure how much people enjoyed the videos. More likes, comments and a higher like to dislike percentage mean people enjoyed the video more. We also create views_per_sub (number of views divided by the number of subscribers) which will be used as the response variable in this study.
###Create varibales to see how much people like the videos
df_all['likes_views_ratio']=df_all['likeCount']/df_all['viewCount']
df_all['likes_subs_ratio']=df_all['likeCount']/df_all['channel_subs']
df_all['comment_views_ratio']=df_all['commentCount']/df_all['viewCount']
df_all['comment_likes_ratio']=(df_all['commentCount']+1)/(df_all['likeCount']+1)
df_all['comment_subs_ratio']=df_all['commentCount']/df_all['channel_subs']
df_all['views_favorite_ratio']=df_all['favoriteCount']/df_all['viewCount']
df_all['like_percent']=df_all['likeCount']/(df_all['likeCount']+df_all['dislikeCount'])

max_date=max(df_all['upload_date'])

df_all['days_since_upload']= (pd.to_datetime(max_date) - pd.to_datetime(df_all['upload_date'])).dt.days +1

df_all['views_per_sub'] = df_all['viewCount']/df_all['channel_subs']
3.2. Preprocessing the categorical variables
There are several ways to deal with categorical values. Here, we’ll use dummy variables, which will create new columns indicating the presence or absence of each value in the original data. However, if a categorical variable has too many levels, then it may make the model too complicated. We will check the categorical variables for their unique values, and create dummy variables from the ones with few levels.
df_model = df_all[['title_len', 'words', 'upper_pct', 'upload_day', 'upload_time_of_day',
       'viewCount','views_per_sub', 'likeCount', 'dislikeCount', 'favoriteCount',
       'commentCount', 'duration', 'definition', 'caption', 'licensedContent',
       'thumbnail_h', 'num_tags',
       'categoryId', 'liveBroadcastContent', 'channel_subs',
       'channel_views', 'channel_videos',
       'adult', 'medical', 'racy', 'spoof', 'violence',
       'emoji_count', 'thumb_word_count', 'title_in_desc',
       'thumb_words_in_title', 'thumb_words_in_tags', 'label_words_in_title',
       'label_words_in_tags', 'days_since_upload', 'likes_views_ratio','comment_views_ratio',
       'likes_subs_ratio', 'comment_likes_ratio','comment_subs_ratio',
       'views_favorite_ratio', 'like_percent','faces_surprised','faces_happy','faces_angry','faces_other',
                  'topic_entertain','topic_video_game','topic_music','topic_film_tv']]

# Select categorical columns with no more than 50 unique values
cat_x_vars=['upload_day', 'upload_time_of_day', 'caption','thumbnail_h',
       'categoryId', 'title_in_desc',
       'adult', 'medical', 'racy', 'spoof', 'violence','topic_entertain','topic_video_game','topic_music','topic_film_tv']

for i in df_all.columns:
    temp_df = pd.DataFrame(df_all[i].value_counts(normalize=True).sort_values(ascending=False))
    if shape(temp_df)[0] <= 50 and i in cat_x_vars:
        print(temp_df)

# Create dummy variables
cat_features = pd.get_dummies(df_model[cat_x_vars])
   upload_day
4    0.204060
5    0.170224
6    0.153045
1    0.136387
0    0.117647
3    0.110359
2    0.108277
            upload_time_of_day
afternoon             0.591879
night                 0.243623
morning               0.096304
late_night            0.068194
        caption
False  0.947944
True   0.052056
     thumbnail_h
720     0.783967
360     0.216033
    categoryId
24    0.453930
20    0.279021
23    0.181676
10    0.042686
22    0.025508
99    0.017179
             adult
UNLIKELY  0.977095
LIKLEY    0.022905
           medical
UNLIKELY  0.993753
LIKLEY    0.006247
              racy
UNLIKELY  0.855804
LIKLEY    0.144196
             spoof
UNLIKELY  0.590318
LIKLEY    0.409682
          violence
UNLIKELY  0.977616
LIKLEY    0.022384
   topic_entertain
0         0.500781
1         0.499219
   topic_video_game
0          0.636648
1          0.363352
   topic_music
0     0.917751
1     0.082249
   topic_film_tv
0       0.849558
1       0.150442
   title_in_desc
0       0.890682
1       0.109318
3.3. Prepare Numeric Variables
We will check the values of the numeric variables, and will plot a correlation matrix to check for multicollinearity.
#List of numeric explanatory variables
num_x_vars=['title_len', 'upper_pct', 'duration', 'num_tags',
       'emoji_count', 'thumb_word_count', 'like_percent',
       'thumb_words_in_title', 'thumb_words_in_tags', 'label_words_in_title',
       'label_words_in_tags','faces_surprised','faces_happy','faces_angry','faces_other',
       'days_since_upload', 'comment_likes_ratio','likes_views_ratio','comment_views_ratio','channel_subs']

#, , 'channel_videos','comment_views_ratio', 'views_favorite_ratio', 'like_percent','views_like_ratio',
num_features=df_model[num_x_vars]

for var in num_x_vars:
    num_features[var] = num_features[var].astype(float)

print(num_features.describe())

plt.figure(figsize=(20,20))
sns.heatmap(num_features.corr(),annot=True,cmap="RdYlGn",annot_kws={"size":15})
        title_len    upper_pct     duration     num_tags  emoji_count  \
count  1921.00000  1921.000000  1921.000000  1921.000000  1921.000000
mean     51.21291     0.265635    10.479785    20.554919     0.046851
std      19.57254     0.329268    18.656555    12.036240     0.211374
min       5.00000     0.000000     0.116667     1.000000     0.000000
25%      37.00000     0.000000     3.500000    12.000000     0.000000
50%      49.00000     0.125000     6.166667    20.000000     0.000000
75%      63.00000     0.428571    11.033333    26.000000     0.000000
max     100.00000     1.000000   426.416667    75.000000     1.000000

       thumb_word_count  like_percent  thumb_words_in_title  \
count       1921.000000   1921.000000           1921.000000
mean           5.103592      0.974497              2.120770
std            7.720859      0.058053              2.256239
min            0.000000      0.000000              0.000000
25%            1.000000      0.977511              0.000000
50%            4.000000      0.987235              2.000000
75%            6.000000      0.993089              3.000000
max          119.000000      1.000000             15.000000

       thumb_words_in_tags  label_words_in_title  label_words_in_tags  \
count          1921.000000           1921.000000          1921.000000
mean              2.121812              0.105674             0.524727
std               2.404585              0.345769             0.748984
min               0.000000              0.000000             0.000000
25%               0.000000              0.000000             0.000000
50%               2.000000              0.000000             0.000000
75%               3.000000              0.000000             1.000000
max              16.000000              4.000000             5.000000

       faces_surprised  faces_happy  faces_angry  faces_other  \
count      1921.000000  1921.000000  1921.000000  1921.000000
mean          0.141593     0.530453     0.029151     0.978136
std           0.396263     1.066651     0.168275     1.703104
min           0.000000     0.000000     0.000000     0.000000
25%           0.000000     0.000000     0.000000     0.000000
50%           0.000000     0.000000     0.000000     1.000000
75%           0.000000     1.000000     0.000000     1.000000
max           5.000000    10.000000     1.000000    15.000000

       days_since_upload  comment_likes_ratio  likes_views_ratio  \
count        1921.000000          1921.000000        1921.000000
mean          668.486205             0.195783           0.058412
std           593.959511             0.234678           0.039696
min             1.000000             0.000279           0.000000
25%           228.000000             0.065842           0.035937
50%           493.000000             0.110582           0.050722
75%           878.000000             0.246032           0.068607
max          3216.000000             4.000000           0.352941

       comment_views_ratio  channel_subs
count          1921.000000  1.921000e+03
mean              0.012644  1.335873e+06
std               0.022189  1.771666e+06
min               0.000000  3.870000e+02
25%               0.002572  1.170000e+04
50%               0.005084  3.610000e+05
75%               0.011447  2.100000e+06
max               0.236364  6.810000e+06


<AxesSubplot:>
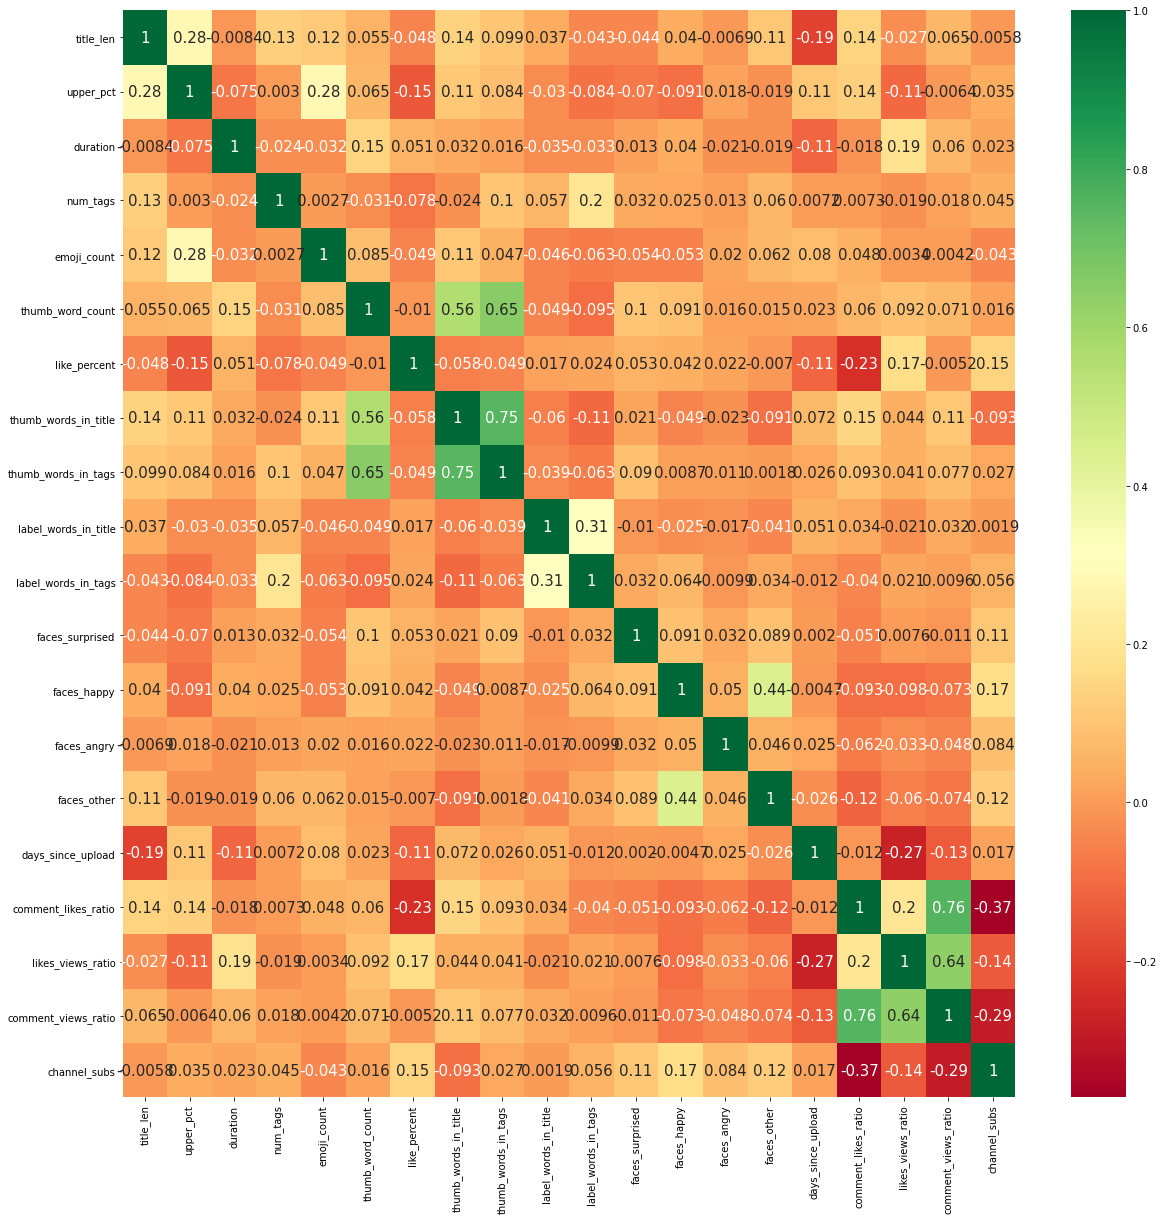
There are a few features that have fairly high correlations with each other, but nothing is concerning.
4. Define a Model
We are working with XGBoost, one of the most effective machine learning algorithms, that presents great results in many Kaggle competitions. We will be using XGBoost for classification. We want to see which videos have the highest views per subscriber. We will create the response of prediction variable using views_per_sub. The response variable is called high_views and is 1 if the video is in the top 50% of views_per_sub, and 0 if the video is in the lower 50% of views_per_sub.
df_model['high_views'] = pd.qcut(df_model['views_per_sub'], [0,0.5, 1], labels=[0,1])

# pred_features = np.power(df_model2['viewCount'].astype(float),1/6)
pred_features = df_model['high_views'].astype(int)

# data = pd.concat([cat_features,num_features],axis=1)
X_data=pd.concat([cat_features,num_features],axis=1)
y_data=pred_features
4.1 Training and Test Datasets
We will separate our data into a training dataset and a testing dataset. Scikit-learn’s train_test_split does this for us automatically. Then we will feed these datasets into the XGBoost classifier, and use cross validation to select the optimal hyperparameters.
def split_data_train_model(labels, data):
    # 20% examples in test data
    train, test, train_labels, test_labels = train_test_split(X_data,
                                                              y_data,
                                                              test_size=0.2)

    return test, test_labels, regressor
4.2 Hyperparameter tuning
XGBoost in its default setup usually yields great results, but it also has plenty of hyperparameters that can be optimized to improve the model. Here, we’ll use a method called GridSearchCV which will search over specified parameter values and return the best ones. GridSearchCV will perform search over parameters we give it to see which ones are best. It is computationally expensive to search over several parameters, so we will use an iterative approach; providing a few parameters, and then repeating the process to narrow in on the most optimal ones.
X_train, X_test, y_train, y_test = train_test_split(X_data,y_data,test_size=0.2)

# param_grid={
#     'n_estimators':[250,500,750],
#     'max_depth':[4,6,8],
#     'learning_rate': [.1,.3,.5],
#     "min_child_weight": [ .5,1, 1.5],
#     'gamma': [0,.5,1],
#     'reg_lambda': [0,5,10],
# }

# #Round2
# param_grid={
#     'n_estimators':[50,100,300],
#     'max_depth':[5,6,7],
#     'learning_rate': [.25,.3,.35],
#     "min_child_weight": [ .5,1, 1.5],
#     'gamma': [0,.1,.25],
#     'reg_lambda': [3,5,7],
# }


# #Round3
# param_grid={
#     'n_estimators':[20,50,70],
#     'max_depth':[6],
#     'learning_rate': [.3],
#     "min_child_weight": [1.5,5,10],
#     'gamma': [.2,.25],
#     'reg_lambda': [7,10,15],
# }

# #Round4
# param_grid={
#     'n_estimators':[65,70,80],
#     'max_depth':[6],
#     'learning_rate': [.3],
#     "min_child_weight": [1.5,2.5],
#     'gamma': [.25],
#     'reg_lambda': [7,8],
# }

#Final hpyerparameters
{'gamma': 0.25, 'learning_rate': 0.3,
 'max_depth': 6, 'min_child_weight': 2.5, 'n_estimators': 80, 'reg_lambda': 7}

optimal_params = GridSearchCV(
estimator=xgb.XGBClassifier(objective="binary:logistic"),
param_grid=param_grid,
verbose=0,
n_jobs=-1,
cv=3
)

optimal_params.fit(X_train,y_train,verbose=True,early_stopping_rounds=10,eval_metric="auc",eval_set=[(X_test,y_test)])
print(optimal_params.best_params_)
As shown in the output above, we narrow in on the final values for each hyperparameter in 4 rounds. These are the values we will set for the final model used to make out prediction for YouTube Video success.
5. Cross-validation
With the optimized hyperparameters, prediction variable and explanatory variables we are ready to run the final model and use cross validation to get the best results. In this study I will create training and testing datasets, and feed them into the XGBoost classifier. Then I will use the model created output the predictions made using the test data. Then I will repeat this process several times and aggregate the results. This way I will be surer of the predictions, and of contributions of each feature to the predictions.
warnings.filterwarnings('ignore')
warnings.simplefilter('ignore')

def run_xgboost():

    X_train, X_test, y_train, y_test = train_test_split(X_data,y_data,test_size=0.2)
    reg_xgb = xgb.XGBClassifier(objective="binary:logistic",n_estimators=80, max_depth=6,
    learning_rate=.3,min_child_weight=2.5,gamma=.25,reg_lambda=7)
    reg_xgb.fit(X_train,y_train,verbose=False,early_stopping_rounds=10,eval_metric="auc",eval_set=[(X_test,y_test)])
    explainer = shap.TreeExplainer(reg_xgb)
    shap_values = explainer.shap_values(X_train.reset_index().drop('index',axis=1))
    predictions = reg_xgb.predict(X_test, ntree_limit = 0)
    pred_probs = reg_xgb.predict_proba(X_test)[:, 1]
    df_preds = pd.concat([X_test.reset_index(),pd.DataFrame(y_test,columns=["high_views"]).reset_index(),pd.DataFrame(predictions,columns=["preds"]),pd.DataFrame(pred_probs,columns=["pred_probs"])],axis=1).drop('index',axis=1)
    return X_train,shap_values,df_preds

for i in range(20):

    if i ==0:
        X_train,shap_values,df_preds = run_xgboost()
        df_all_X_train = X_train.reset_index().drop('index',axis=1)
        df_all_preds = df_preds
        all_shap_values = shap_values

    else:
        X_train,shap_values,df_preds = run_xgboost()
        df_all_X_train = pd.concat([df_all_X_train,X_train.reset_index().drop('index',axis=1)], ignore_index=True)
        df_all_preds = pd.concat([df_all_preds,df_preds], ignore_index=True)
        all_shap_values=np.append(all_shap_values,shap_values,axis=0)
In the code chunk above notice that we also output the shap values for each prediction we make. We will go over this more in the next section.
6. Interpret the Results
We want to know how well the model performed in correctly classifying which YouTube videos were successful and which were not in the test datasets. We also want to know which features contributed the most to predicting the success of the YouTube videos.
6.1 Accuracy
In our study the accuracy is the percent of success YouTube videos correctly classified as successful plus the percent of unsuccessful videos correctly classified as unsuccessful. Below calculate the null accuracy and accuracy of the model. The null accuracy is the accuracy we would achieve if we were to assign each prediction solely based on the most likely outcome. In our case the model needs to have accuracy greater than 50% or it is not useful. Our model classifies successful YouTube videos with 86% accuracy.
accuracy = accuracy_score(df_all_preds['high_views'], df_all_preds['preds'])
null_accuracy = max((df_all_preds['high_views'].mean(),1-df_all_preds['high_views'].mean()))
print(f'Null Accuracy Score: {null_accuracy}')
print(f'Accuracy Score: {accuracy}')
Null Accuracy Score: 0.5016883116883117
Accuracy Score: 0.862987012987013
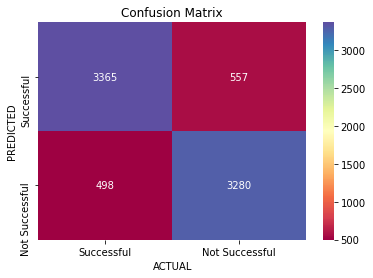
6.2 Confusion Matrix
The confusion matrix describes the performance of the classification model. This will show us how the predictions compare to the observed values for YouTube performance. As we see in the confusion matrix the model does well in predicting both successful and unsuccessful videos.
tn, fp, fn, tp = confusion_matrix(df_all_preds['high_views'], df_all_preds['preds']).ravel()
cm = [[tp,fp],[fn,tn]]

#Plot the matrix

fig, ax = plt.subplots()
sns.heatmap(cm, annot=True, fmt = "d", cmap="Spectral")
# labels, title and ticks
ax.set_xlabel('ACTUAL')
ax.set_ylabel('PREDICTED')
ax.set_title('Confusion Matrix')
ax.xaxis.set_ticklabels(['Successful', 'Not Successful'])
ax.yaxis.set_ticklabels(['Successful', 'Not Successful'])
[Text(0, 0.5, 'Successful'), Text(0, 1.5, 'Not Successful')]
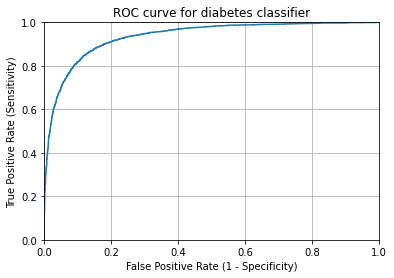
6.3 ROC Curves and Area Under the Curve (AUC)
The ROC curve shows the trade-off between true positive rate and false positive rate for different thresholds. The closer the curve “hugs” the top left corner of the graph the better overall job the model does with classification. The way to measure this is AUC which is the area underneath the ROC curve. A perfect classifier would have an AUC of 1. As we can see the AUC is 0.93. Our model does a very good job of classifying.
# IMPORTANT: first argument is true values, second argument is predicted probabilities
fpr, tpr, thresholds = roc_curve( df_all_preds['high_views'],  df_all_preds['pred_probs'])
plt.plot(fpr, tpr)
plt.xlim([0.0, 1.0])
plt.ylim([0.0, 1.0])
plt.title('ROC curve for diabetes classifier')
plt.xlabel('False Positive Rate (1 - Specificity)')
plt.ylabel('True Positive Rate (Sensitivity)')
plt.grid(True)
print("The AUC is "+ str(roc_auc_score(df_all_preds['high_views'],  df_all_preds['pred_probs'])))
The AUC is 0.9350790708964738
6.4 Feature Importance and Effects
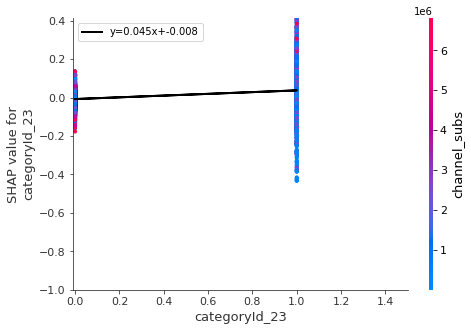
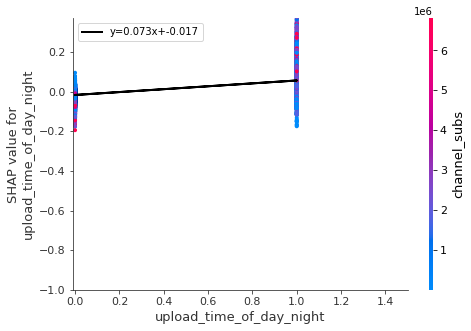
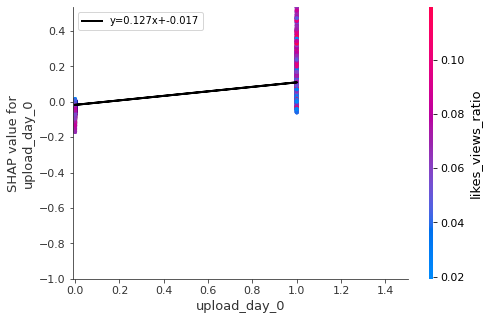
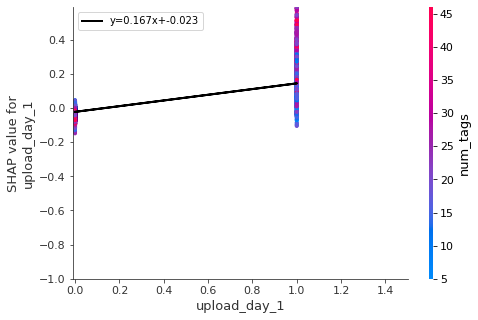
We are interested in knowing that the model is accurate in predicting video success, but we also want to know which features were the most important in determining success, and how we can apply that in making future videos get more views. One way of doing this is using SHAP values. Shap values attempt to show how much each feature contributes to its prediction. Features with large SHAP values (positive or negative) are more important and influential on the predictions.
shap.summary_plot(all_shap_values,df_all_X_train,max_display=30)
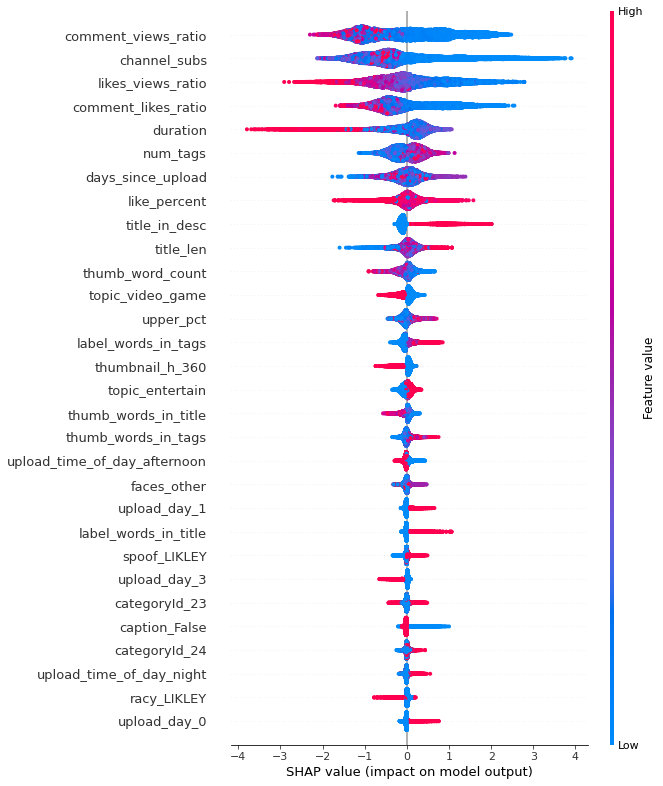
The chart above is sorted from most important feature to least (only the top 30 features are shown). The heat map shows the values for each point (red is high, and blue is low). For some features higher values lead to SHAP values above 0 and for others it is the opposite. Below we will plot some of the most important features in separate graphs to draw conclusions.
warnings.filterwarnings('ignore')
warnings.simplefilter('ignore')
vals= np.abs(all_shap_values).mean(0)
feature_importance = pd.DataFrame(list(zip(df_all_X_train.columns,vals)),columns=['col_name','feature_importance_vals'])
feature_importance.sort_values(by=['feature_importance_vals'],ascending=False,inplace=True)
most_imortant = feature_importance["col_name"][:30]
keeps= ['comment_views_ratio','likes_views_ratio','duration'
,'num_tags','title_in_desc','title_len'
,'thumb_word_count','thumbnail_h_360','categoryId_23'
,'upload_time_of_day_night','upload_day_0','upload_day_1'
,'caption_False','spoof_LIKLEY','faces_happy']
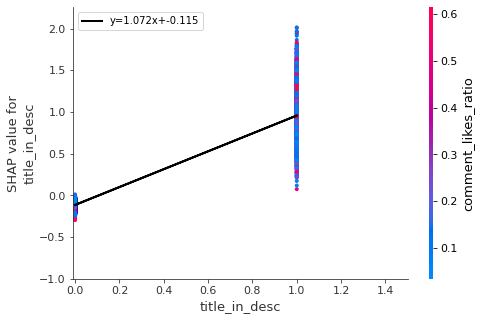
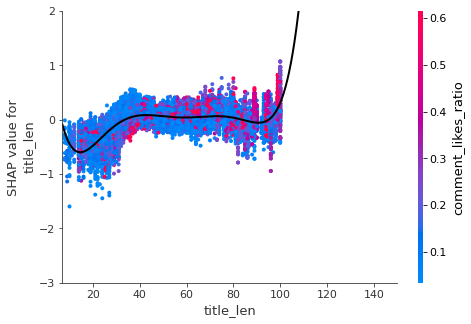
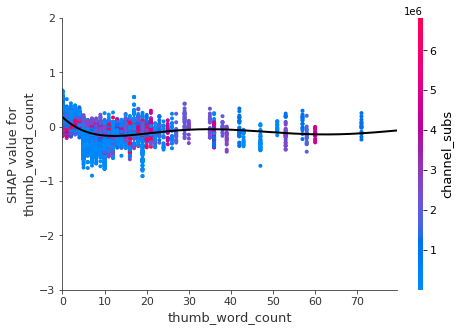
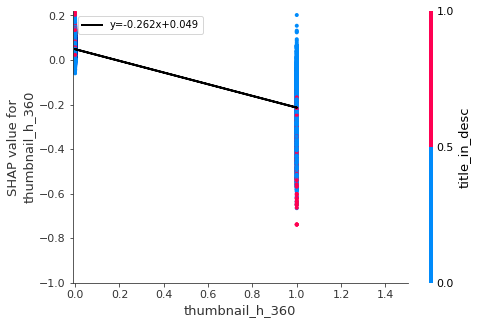
for i in keeps:
shap.dependence_plot(i,all_shap_values,df_all_X_train,show=False)
x=df_all_X_train[i]
y=[item[df_all_X_train.columns.get_loc(i)] for item in all_shap_values]
if i in num_x_vars:
mymodel=np.poly1d(np.polyfit(x,y,6))
myline = np.linspace(0,10000,1000000)
pl.plot(myline,mymodel(myline), '-k' , linewidth=2)
pl.xlim(x.quantile(q=.005)*.5-.01,x.quantile(q=.995)*1.5)
pl.ylim(min(np.quantile(y,.005)*.5-.01,-3),max(np.quantile(y,.995)*1.5,2))
pl.show()
else:
m, b = pl.polyfit( x, y , 1 )
pl.plot(x, m * x+b , '-k' , linewidth=2,label='y='+str(round(m,3))+'x+'+str(round(b,3)))
pl.legend(loc='upper left')
pl.xlim(min(x.quantile(q=.01)*.5,-.01),max(x.quantile(q=.99)*1.5,1))
pl.ylim(min(np.quantile(y,.005)*.5,-1),max(np.quantile(y,.995)*1.5,.01))
pl.show()
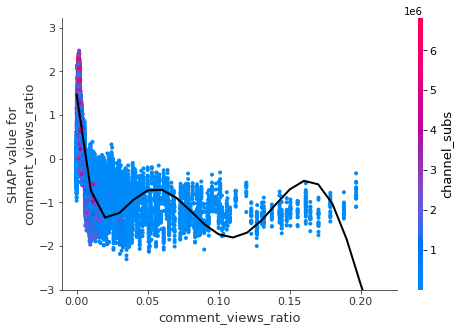
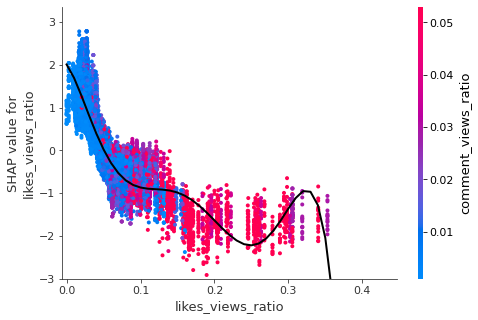
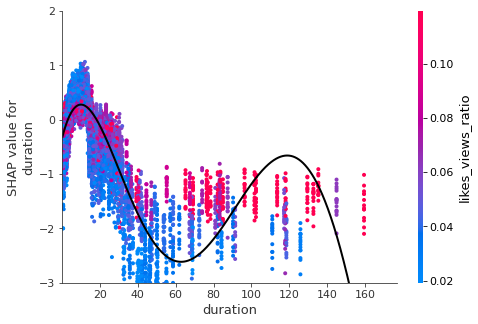
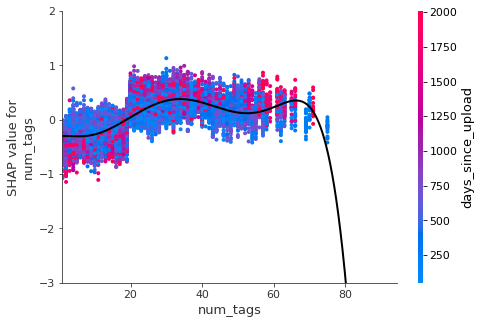
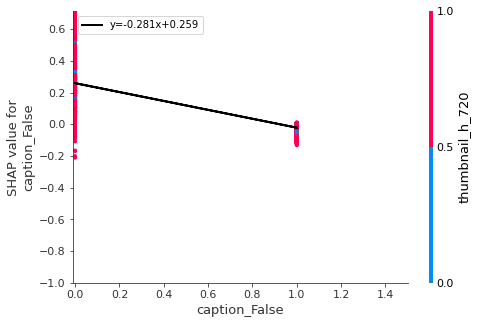
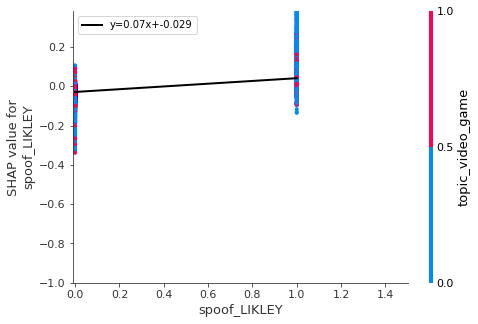
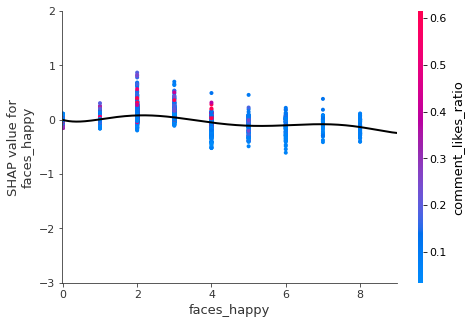
7. Conclusion
We successfully predicted the success of YouTube videos with 86% accuracy. Here are some of the factors that contribute to a successful YouTube Video among the channels we studied.
- A successful video last between 6 to 12 minutes (around 10 minutes videos perform the best).
- When uploading video one should have at least 20 tags
- Put the title of the video in the description
- Videos with short titles (less than 40 characters) didn’t perform as well
- The thumbnail image should include as few words as possible and should be high definition
- Night is the best time to upload (after 6 pm), but not too late. Also the best days are Monday and Tuesday
- We should add captions to videos instead of just letting them be auto generated
- There should be two to three happy faces in thumbnail
- Thumbnail image should be “spoofed” (i.e. should try to make it seem funnier or crazier than it is).